• Welcome to the new COTI server. We've moved the Citizens to a new server. Please let us know in the COTI Website issue forum if you find any problems.
  • We, the systems administration staff, apologize for this unexpected outage of the boards. We have resolved the root cause of the problem and there should be no further disruptions.

Realistic Population Size and Benford's Law

An interesting and sometimes counterintuitive fact is that population sizes in nature are 30% likely to start with the digit 1. This is called Benford's law (see http://en.wikipedia.org/wiki/Benford's_law ). This law works on the population sizes of countries on Earth (have a look at world population sizes and count how many start with 1 if you don't believe me! You'll see that roughly 30% start with a 1!!!)

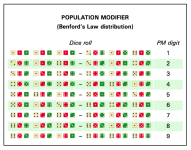
To accurately model a world's population I propose this method. Roll for the world population using the 2 D - 2 method to tell you the exponent of 10 that gives the world population order of magnitude. Then use percentile dice to find out the leading digit:

digit % roll
1 1-30
2 31-48
3 49-60
4 61-70
5 71-78
6 79-85
7 86-92
8 93-97
9 98-00

This method will give you a population with a leading digit roughly in accordance with Benford's law.

For the second digit I propose simply rolling a 10 sided die.

Example 1: I roll 2D-2 and get 6. So I know that the population of the world in the millions. So to find out how many million I roll percentile dice and come up with 72, so the first digit is 5. I roll one ten sided die for the second digit and come up with 9. So the population of this world is 5.9 million.

Example 2: I roll 2D-2 and get 7. So I know that the population of the world in the tens of millions. I roll percentile dice and come up with 51, so the first digit is 3. I roll one ten sided die for the second digit and come up with 3. So the population of this world is 33 million.

Example 3: I roll 2D-2 and get A. So I know the population of the world in the tens of billions. I roll percentile dice and come up with 29, so the first digit is 1. I roll one ten sided die for the second digit and come up with 6. So the population of this world is 16 billion.

I like this method because it is a little bit realistic. Some people might not like using percentile dice to work out the digits. In that case you'd need to assign probabilities using multiple 6 sided dice added together on a bell curve. This would entail a bit more work.
 
At that point, one may as well just use a d10000 table instead... and generate both simultaneously.

BTW, Joshua, your table is only valid for Pop 5+
 
Because the distribution will be

Code:
|     \
|    \ \
|   \   \
|  \     \
| \       \
|\         \
+------------

A partial fix is to swap the pop multipliers for below 5... but you still wind up with a break between 4 and 5

Code:
|     \
|    / \
|   /   \
|  /     \
| /       \
|/         \
+------------
 
I think I see what you're saying. What my method is doing is taking a bell curve peaked at 5 (with numbers from 0 to A), then trying to modify for Benford's law. So yes, the system is only realistically valid for numbers 5+.

To get round this problem, I would assume that worlds with lower populations are often not important enough to make it onto the subsector map. If this is the case then it can explain the low number of worlds of 4- population size. Then the method can be validly applied.
 
in a random sector, Pop 1-4 worlds are 7/18 of all worlds. 38%.

Closer to 20% in the published sectors, but still...
 
It's a clever idea, though.

You can get closer to Benford by mapping a pop digit roll, couldn't you?

Code:
2D Roll    Pop Digit
2               9
3               7
4               5
5               1
6               1
7               1
8               2
9               3
10              4    
11              6
12              8
 
You can get closer to Benford by mapping a pop digit roll, couldn't you?
The question that pops into my mind is "why would we want to?"

Benford's Law seems to be an observation of a condition that is counter-intutive and unexplained. It may be true, but it sounds phony (Not as phony as rolling 2D6-2 for population multiplier, but close ;)). As far as I'm concerned, if population multipliers aren't evenly distributed from 1 to 9, it's high time they were.

(I'm only about 2/7th kidding).


Hans
 
I agree it should be evenly distributed. Or are we to believe that population growth purposely tries to obtain a "1" for it's first digit? Wait, is that Solomani numbering or Vilani? :)

Our numbering system begins with 1. Imagine a pool of numbers with even distribution of 1 to 100. 12% start with 1. Let's cut that in half to to 1 to 50. Suddenly 1s jump to 22%! Wait..what if we double the range to 1 to 200. Oh my now 1s jump to about 55%!!! The 1s are over-taking us!

Because we start counting with the number 1.

An example given by Benford's law were addresses. Think about this one. Most addresses (at least in the US) follow blocks. A.i. 1000 North 5th Street, 1100 North 5th Street, 1200 North 5th Street, etc. Of course in a city we reach higher block numbers that can start to even things out (but 1s still have that slight advantage due to starting with 1). The problem is the countless small towns that greatly outnumber the cities that might only have around 20 blocks. So, 100 N 5th, 200 N 5th, 300 N 5th....to 20000 N 5th could be typical in these towns. You hit the "teens" that ALL start with a 1 without hitting the 30000's, 40000's, etc that are found only in the rarer, larger, cities.

It's mathematical mumbo jumbo. It's a product of the numbering system, not the population actually seeking to grow towards a number that starts with 1. I mean even typing that last sentence was non-sensical.
 
Last edited:
It's mathematical mumbo jumbo. It's a product of the numbering system, not the population actually seeking to grow towards a number that starts with 1. I mean even typing that last sentence was non-sensical.

I wouldn't say it is without meaning.

1.00
1.10
1.21
1.33
1.46
1.61
1.77
1.95
2.14
2.36
2.59
2.85
3.14
3.45
3.80
4.18
4.59
5.05
5.56
6.12
6.73
7.40
8.14
8.95
9.85
10.8

initial integers:

8x1
4x2
3x3
2x4,5,6,8
1x7,9

And obviously the pattern starts all over again at 10-100.

If you assume zero growth, then it wouldn't have any impact. But growth in either direction will cause this "artifact of the numbering system" to rear its head. I guess it depends on how realistic you want that particular figure.
 
An interesting and sometimes counterintuitive fact is that population sizes in nature are 30% likely to start with the digit 1. This is called Benford’s law (see http://en.wikipedia.org/wiki/Benford's_law ).
For this reason, it’s not the population digit that should reflect Benford’s Law, but rather the population modifier (PM) digit that should reflect it, since the PM digit will be the first (i.e. most significant) digit of the population. A bell curve is perfectly fine as a distribution of the population digit; for example, the distribution of US county populations from the 2020 census expressed as population digits reflect a bell curve.

The attached image below shows the approach that I use for generating a PM digit that reflects Benford’s Law. I use three six-sided dice of different colors, and roll the trio between one and three times. (The attached image shows a white die being treated as the first die, a red die being treated as the second die, and a green die being treated as the third die for all rolls.) For example, if on the first roll ⚃⚁⚄ were thrown, it would result in a PM digit of 3 without additional rolls being required, since any second and third rolls following ⚃⚁⚄ would fall in the dice roll range that corresponds to PM 3. But if the first roll were ⚅⚀⚂, then a second roll would be needed to determine whether the PM digit would be 6 or 7; and only if the second roll were ⚃⚁⚂ would a third roll be necessary.

Thus, of the 216 permutations of three six-sided dice, 208 of them would only require one roll to determine the PM digit; and in the eight instances when a second roll is required, only one of its 216 permutations would require a third roll.
 

Attachments

  • Benford_PM.png
    Benford_PM.png
    70.5 KB · Views: 4
Roll 1d6, on 1-2 the leading number is 1, else roll normally.

Done.
That’s certainly one way to generate a PM digit, but it isn’t a Benford’s Law distribution, which is logarithmic in nature — 1 is more frequent than 2, 2 is more frequent than 3, 3 is more frequent than 4, &c.
 
1D:leading digit
1,2:1
3:2
4:3
5+:1D+3

gives a close approximation (less 4,5,6, more 1,3,8,9)
It’s an interesting approach with only two dice. Here’s how I see a Benford’s Law distribution compared to your method:

PM digitBenford’s LawKrikkitonecomparison
1log(2) ≅ 0.301031⁄3 ≅ 0.33333110.73%
2log(3⁄2) ≅ 0.176091⁄6 ≅ 0.1666794.65%
3log(4⁄3) ≅ 0.124941⁄6 ≅ 0.16667133.40%
4log(5⁄4) ≅ 0.096911⁄18 ≅ 0.0555657.33%
5log(6⁄5) ≅ 0.079181⁄18 ≅ 0.0555670.16%
6log(7⁄6) ≅ 0.066951⁄18 ≅ 0.0555682.98%
7log(8⁄7) ≅ 0.057991⁄18 ≅ 0.0555695.80%
8log(9⁄8) ≅ 0.051151⁄18 ≅ 0.05556108.61%
9log(10⁄9) ≅ 0.045761⁄18 ≅ 0.05556121.41%

Unfortunately two dice aren’t enough to reflect Benford’s Law well; the 4, the 3, and the 5 are the farthest off, but the 2 and the 7 are the closest, both within 6% of Benford’s Law. That’s why I’d used nine dice in my method, in which only three dice need to be rolled 26⁄27 of the time; with nine dice, the farthest off comparison is 99.999934%.
 
I use the 1D100 method in the first post in code I write.
For the 2D6 purists, this table gets you close enough (altho the percentages for 7 and 8 are the same, and for 5 and 6, and for 3 and 4).
Roll Multiple
2 - 1
3 - 7
4 - 5
5 - 3
6 - 1
7 - 2
8 - 1
9 - 4
10 - 6
11 - 8
12 - 9

Or if you don't mind using just a D20:
First Roll Second Roll Result
1-6 - no roll - 1
7-12 - 1-12 - 2
7-12 - 13-20 - 3
13-14 - no roll - 4
15-18 - 1-8 - 5
15-18 - 9-15 - 6
15-18 - 16-20 - 8
19-20 - 1-12 - 7
19-20 - 13-20 - 9
This gives the same results as the 1D100.
 
Last edited:
Veering away from Benford's Law and the population numbers, if we are discussing realistic population sizes shouldn't we also be considering the effect of the mainworld characteristics (size, atmosphere, hydrographics, temperature/climate)?
After all, surely colonies would preferentially choose to establish on "garden" worlds over worlds with extreme conditions? Wouldn't they then tend to grow to (or sometimes beyond) the maximum sustainable population?
 
I use the 1D100 method in [joshuawood’s] first post in code I write.

If your preferred programming language has a function for common logarithms, e.g. log10() in C, you could just use its values directly to avoid inaccuracy caused by emulating dice rolls. For example, in pseudo-C,

C-like:
#include <math.h>

/* the first element in the threshold array is not used */
static double threshold[10] =
{
   0.0, log10(2.0), log10(3.0), log10(4.0), log10(5.0),
   log10(6.0), log10(7.0), log10(8.0), log10(9.0), 1.0
};

/* such that 0.0 ≤ random_number < 1.0 */
double random_number = your_preferred_random_number_generator();

unsigned int possible_population_modifier, actual_population_modifier;

for (possible_population_modifier = 1; possible_population_modifier <= 9; ++possible_population_modifier)
{
   if (random_number < threshold[possible_population_modifier])
   {
      actual_population_modifier = possible_population_modifier;
      break;
   }
}

Here is how a Benford’s Law distribution compares to joshuawood’s distribution:

PMBenford’s Lawjoshuawood D100comparison
1log(2) ≅ 0.301033⁄10 = 0.399.66%
2log(3⁄2) ≅ 0.176099⁄50 = 0.18102.22%
3log(4⁄3) ≅ 0.124943⁄25 = 0.1296.05%
4log(5⁄4) ≅ 0.096911⁄10 = 0.1103.19%
5log(6⁄5) ≅ 0.079184⁄25 = 0.08101.03%
6log(7⁄6) ≅ 0.066957⁄100 = 0.07104.56%
7log(8⁄7) ≅ 0.057993⁄50 = 0.06103.46%
8log(9⁄8) ≅ 0.051151⁄20 = 0.0597.75%
9log(10⁄9) ≅ 0.045761⁄25 = 0.0487.42%

Only PM 9 is reflected poorly; all of the other PM digits are within 5% of Benford’s Law.

To minimize the error further, an additional die could be used; for example, one could use three ten- or twenty-sided dice of different colors on a permutation basis as a virtual D1000 in tandem with the following ranges:

D1000 rollPM digitD1000 probabilityD1000 comparison
001–30110.30199.99%
302–47720.17699.95%
478–60230.125100.05%
603–69940.097100.09%
700–77850.07999.77%
779–84560.067100.08%
846–90370.058100.01%
904–95480.05199.70%
955–00090.046100.53%

PM 9 is still the least representative, but with D1000 it’s only out by 0.53%, and the other PM digits are all within 0.3%.

(For Traveller, I try to stick with six-sided dice as much as possible, which influenced the design of the attached PM table in my first post above.)
 
if we are discussing realistic population sizes shouldn't we also be considering the effect of the mainworld characteristics (size, atmosphere, hydrographics, temperature/climate)?

Yes, such effects should be considered. What improvements would you like to see in UWP generation?

After all, surely colonies would preferentially choose to establish on "garden" worlds over worlds with extreme conditions? Wouldn't they then tend to grow to (or sometimes beyond) the maximum sustainable population?

That might depend upon the nature of the colony; for example, a mining colony might prefer to have ready access to rich veins of valuable elements over ideal agricultural conditions. A mining colony would only grow as long as it could economically obtain the elements which are in demand. An unsustainable population in any colony would be limited by time; one that is currently unsustainable could experience a population crash in the future. (Whether that future is generations away or months away would depend upon the nature of the constrained resource(s).)
 
Yes, such effects should be considered. What improvements would you like to see in UWP generation?
That's something I keep having a go at and getting frustrated by. I've been looking at various DMs (negative and positive) for size, atmosphere and hydrographics but haven't produced any results that feel right so far (results ending up being too extreme or you end up with the majority of worlds having zero population or sometimes both).
That might depend upon the nature of the colony; for example, a mining colony might prefer to have ready access to rich veins of valuable elements over ideal agricultural conditions. A mining colony would only grow as long as it could economically obtain the elements which are in demand. An unsustainable population in any colony would be limited by time; one that is currently unsustainable could experience a population crash in the future. (Whether that future is generations away or months away would depend upon the nature of the constrained resource(s).)
The reason for establishing a colony would definitely have an impact on the preferred type of world, as would the "sponsor" of the colony. A mining colony would normally be established by a megacorporation and the colonists would be their employees (and families). Colonies established to relieve over-population elsewhere would tend to favour garden worlds.
 
Back
Top